Table of Contents
1. The Role of Statistics in Engineering
1.1 The Engineering Method and Statistical Thinking
1.1.1 Variability
1.1.2 Populations and Samples
1.2 Collecting Engineering Data
1.2.1 Basic Principles
1.2.2 Retrospective Study
1.2.3 Observational Study
1.2.4 Designed Experiments
1.2.5 Observing Processes Over Time
1.3 Mechanistic and Empirical Models
1.4 Probability and Probability Models
2. Probability
2.1.1 Random Experiments
2.1.2 Sample Spaces
2.1.3 Events
2.2 Counting Techniques
2.3 Interpretations and Axioms of Probability
2.4 Unions of Events and Addition Rules
2.5 Conditional Probability
2.6 Intersections of Events and Multiplication and Total Probability Rules
2.7 Independence
2.8 Bayes’ Theorem
2.9 Random Variables
2.10 Exercises
3. Discrete Random Variables and Probability Distributions
3.1 Probability Distributions and Probability Mass Functions
3.2 Cumulative Distribution Functions
3.3 Mean and Variance of a Discrete Random Variable
3.4 Discrete Uniform Distribution
3.5 Binomial Distribution
3.6 Geometric and Negative Binomial Distributions
3.7 Hypergeometric Distribution
3.8 Poisson Distribution
3.9 Exercises
4. Continuous Random Variables and Probability Distributions
4.1 Probability Distributions and Probability Density Functions
4.2 Cumulative Distribution Functions
4.3 Mean and Variance of a Continuous Random Variable
4.4 Continuous Uniform Distribution
4.5 Normal Distribution
4.6 Normal Approximation to the Binomial and Poisson Distributions
4.7 Exponential Distribution
4.8 Erlang and Gamma Distributions
4.9 Weibull Distribution
4.10 Lognormal Distribution
4.11 Beta Distribution
4.12 Exercises
5. Joint Probability Distributions
5.1 Joint Probability Distributions for Two Random Variables
5.2 Conditional Probability Distributions and Independence
5.3 Joint Probability Distributions for More Than Two Random Variables
5.4 Covariance and Correlation
5.5 Common Joint Distributions
5.5.1 Multinomial Probability Distribution
5.5.2 Bivariate Normal Distribution
5.6 Linear Functions of Random Variables
5.7 General Functions of Random Variables
5.8 Moment-Generating Functions
5.9 Exercises
6. Descriptive Statistics
6.1 Numerical Summaries of Data
6.2 Stem-and-Leaf Diagrams
6.3 Frequency Distributions and Histograms
6.4 Box Plots
6.5 Time Sequence Plots
6.6 Scatter Diagrams
6.7 Probability Plots
6.8 Exercises
7. Point Estimation of Parameters and Sampling Distributions
7.1 Point Estimation
7.2 Sampling Distributions and the Central Limit Theorem
7.3 General Concepts of Point Estimation
7.3.1 Unbiased Estimators
7.3.2 Variance of a Point Estimator
7.3.3 Standard Error: Reporting a Point Estimate
7.3.4 Bootstrap Standard Error
7.3.5 Mean Squared Error of an Estimator
7.4 Methods of Point Estimation
7.4.1 Method of Moments
7.4.2 Method of Maximum Likelihood
7.4.3 Bayesian Estimation of Parameters
7.5 Exercises
8. Statistical Intervals for a Single Sample
8.1 Confidence Interval on the Mean of a Normal Distribution, Variance Known
8.1.1 Development of the Confidence Interval and Its Basic Properties
8.1.2 Choice of Sample Size
8.1.3 One-Sided Confidence Bounds
8.1.4 General Method to Derive a Confidence Interval
8.1.5 Large-Sample Confidence Interval for μ
8.2 Confidence Interval on the Mean of a Normal Distribution, Variance Unknown
8.2.1 t Distribution
8.2.2 t Confidence Interval on μ
8.3 Confidence Interval on the Variance and Standard Deviation of a Normal Distribution
8.4 Large-Sample Confidence Interval for a Population Proportion
8.5 Guidelines for Constructing Confidence Intervals
8.6 Bootstrap Confidence Interval
8.7 Tolerance and Prediction Intervals
8.7.1 Prediction Interval for a Future Observation
8.7.2 Tolerance Interval for a Normal Distribution
8.8 Exercises
9. Tests of Hypotheses for a Single Sample
9.1 Hypothesis Testing
9.1.1 Statistical Hypotheses
9.1.2 Tests of Statistical Hypotheses
9.1.3 One-Sided and Two-Sided Hypotheses
9.1.4 p-Values in Hypothesis Tests
9.1.5 Connection between Hypothesis Tests and Confidence Intervals
9.1.6 General Procedure for Hypothesis Tests
9.2 Tests on the Mean of a Normal Distribution, Variance Known
9.2.1 Hypothesis Tests on the Mean
9.2.2 Type II Error and Choice of Sample Size
9.2.3 Large-Sample Test
9.3 Tests on the Mean of a Normal Distribution, Variance Unknown
9.3.1 Hypothesis Tests on the Mean
9.3.2 Type II Error and Choice of Sample Size
9.4 Tests on the Variance and Standard Deviation of a Normal Distribution
9.4.1 Hypothesis Tests on the Variance
9.4.2 Type II Error and Choice of Sample Size
9.5 Tests on a Population Proportion
9.5.1 Large-Sample Tests on a Proportion
9.5.2 Type II Error and Choice of Sample Size
9.6 Summary Table of Inference Procedures for a Single Sample
9.7 Testing for Goodness of Fit
9.8 Contingency Table Tests
9.9 Nonparametric Procedures
9.9.1 The Sign Test
9.9.2 The Wilcoxon Signed-Rank Test
9.9.3 Comparison to the t-Test
9.10 Equivalence Testing
9.11 Combining p-Values
9.12 Exercises
10. Statistical Inference for Two Samples
10.1 Inference on the Difference in Means of Two Normal Distributions, Variances Known
10.1.1 Hypothesis Tests on the Difference in Means, Variances Known
10.1.2 Type II Error and Choice of Sample Size
10.1.3 Confidence Interval on the Difference in Means, Variances Known
10.2 Inference on the Difference in Means of Two Normal Distributions, Variances Unknown
10.2.1 Hypotheses Tests on the Difference in Means, Variances Unknown
10.2.2 Type II Error and Choice of Sample Size
10.2.3 Confidence Interval on the Difference in Means, Variances Unknown
10.3 A Nonparametric Test for the Difference in Two Means
10.3.1 Description of the Wilcoxon Rank-Sum Test
10.3.2 Large-Sample Approximation
10.3.3 Comparison to the t-Test
10.4 Paired t-Test
10.5 Inference on the Variances of Two Normal Distributions
10.5.1 F Distribution
10.5.2 Hypothesis Tests on the Equity of Two Variances
10.5.3 Type II Error and Choice of Sample Size
10.5.4 Confidence Interval on the Ratio of Two Variances
10.6 Inference on Two Population Proportions
10.6.1 Large-Sample Tests on the Difference in Population Proportions
10.6.2 Type II Error and Choice of Sample Size
10.6.3 Confidence Interval on the Difference in Population Proportions
10.7 Summary Table and Road Map for Inference Procedures for Two Samples
10.8 Exercises
11. Simple Linear Regression and Correlation
11.1 Empirical Models
11.2 Simple Linear Regression
11.3 Properties of the Least Squares Estimators
11.4 Hypothesis Tests in Simple Linear Regression
11.4.1 Use of t-Tests
11.4.2 Analysis of Variance Approach to Test Significance of Regression
11.5 Confidence Intervals
11.5.1 Confidence Intervals on the Slope and Intercept
11.5.2 Confidence Interval on the Mean Response
11.6 Prediction of New Observations
11.7 Adequacy of the Regression Model
11.7.1 Residual Analysis
11.7.2 Coefficient of Determination (R2)
11.8 Correlation
11.9 Regression on Transformed Variables
11.10 Logistic Regression
11.11 Exercises
12. Multiple Linear Regression
12.1 Multiple Linear Regression Model
12.1.1 Introduction
12.1.2 Least Squares Estimation of the Parameters
12.1.3 Matrix Approach to Multiple Linear Regression
12.1.4 Properties of the Least Squares Estimators
12.2 Hypothesis Tests in Multiple Linear Regression
12.2.1 Test for Significance of Regression
12.2.2 Tests on Individual Regression Coefficients and Subsets of Coefficients
12.3 Confidence Intervals in Multiple Linear Regression
12.3.1 Confidence Intervals on Individual Regression Coefficients
12.3.2 Confidence Interval on the Mean Response
12.4 Prediction of New Observations
12.5 Model Adequacy Checking
12.5.1 Residual Analysis
12.5.2 Influential Observations
12.6 Aspects of Multiple Regression Modeling
12.6.1 Polynomial Regression Models
12.6.2 Categorical Regressors and Indicator Variables
12.6.3 Selection of Variables and Model Building
12.6.4 Multicollinearity
12.7 Exercises
13. Design and Analysis of Single-Factor Experiments: The Analysis of Variance
13.1 Designing Engineering Experiments
13.2 Completely Randomized Single-Factor Experiment
13.2.1 Example: Tensile Strength
13.2.2 Analysis of Variance
13.2.3 Multiple Comparisons Following the ANOVA
13.2.4 Residual Analysis and Model Checking
13.2.5 Determining Sample Size
13.3 The Random-Effects Model
13.3.1 Fixed Versus Random Factors
13.3.2 ANOVA and Variance Components
13.4 Randomized Complete Block Design
13.4.1 Design and Statistical Analysis
13.4.2 Multiple Comparisons
13.4.3 Residual Analysis and Model Checking
13.5 Exercises
14. Design of Experiments with Several Factors
14.1 Introduction
14.2 Factorial Experiments
14.3 Two-Factor Factorial Experiments
14.3.1 Statistical Analysis
14.3.2 Model Adequacy Checking
14.3.3 One Observation per Cell
14.4 General Factorial Experiments
14.5 2k Factorial Designs
14.5.1 22 Design
14.5.2 2k Design for k ≥ 3 Factors
14.6 Single Replicate of the 2k Design
14.7 Addition of Center Points to a 2k Design
14.8 Blocking and Confounding in the 2k Design
14.9 One-Half Fraction of the 2k Design
14.10 Smaller Fractions: The 2k−p Fractional Factorial
14.11 Response Surface Methods and Designs
14.12 Exercises
15. Statistical Quality Control
15.1 Quality Improvement and Statistics
15.1.1 Statistical Quality Control
15.1.2 Statistical Process Control
15.2 Introduction to Control Charts
15.2.1 Basic Principles
15.2.2 Design of a Control Chart
15.2.3 Rational Subgroups
15.2.4 Analysis of Patterns on Control Charts
15.3 X and R or S Control Charts
15.4 Control Charts for Individual Measurements
15.5 Process Capability
15.6 Attribute Control Charts
15.6.1 P Chart (Control Chart for Proportions)
15.6.2 U Chart (Control Chart for Defects per Unit)
15.7 Control Chart Performance
15.8 Time-Weighted Charts
15.8.1 Exponentially Weighted Moving-Average Control Chart
15.8.2 Cumulative Sum Control Chart
15.9 Other SPC Problem-Solving Tools
15.10 Decision Theory
15.10.1 Decision Models
15.10.2 Decision Criteria
15.11 Implementing SPC
15.12 Exercises
16. Appendix: Statistical Tables and Charts
16.1 Stats zyTools and Resources
Normal Distribution Calculator
t-Distribution Calculator
Binomial Distribution Calculator
Visualizing Probability Distributions (graph generator)
16.2 Statistical Tables and Charts
Summary of Common Probability Distributions
Cumulative Binomial Probabilities P(X ≤ x)
Cumulative Standard Normal Distribution
Percentage Points χ2α,v of the Chi-Squared Distribution
Percentage Points tα,v of the t Distribution
Percentage Points fα,v1,v2 of the F Distribution
Operating Characteristic Curves
Critical Values for the Sign Test
Critical Values for the Wilcoxon Signed-Rank Test
Critical Values for the Wilcoxon Rank-Sum Test
Factors for Constructing Variables Control Charts
Factors for Tolerance Intervals
17. Appendix: Bibliography
18 Appendix: Summary of Confidence Intervals and Hypothesis Testing Equations for One and Two Sample Applications
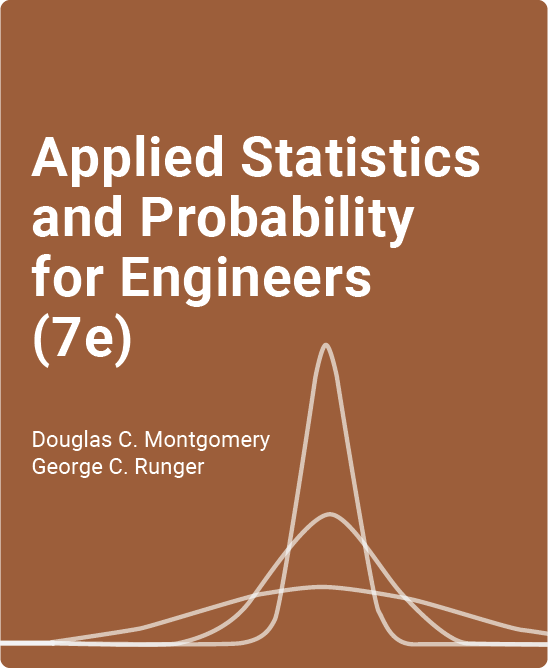
The interactive zyBooks version of a classic introduction to statistics and probability for engineers
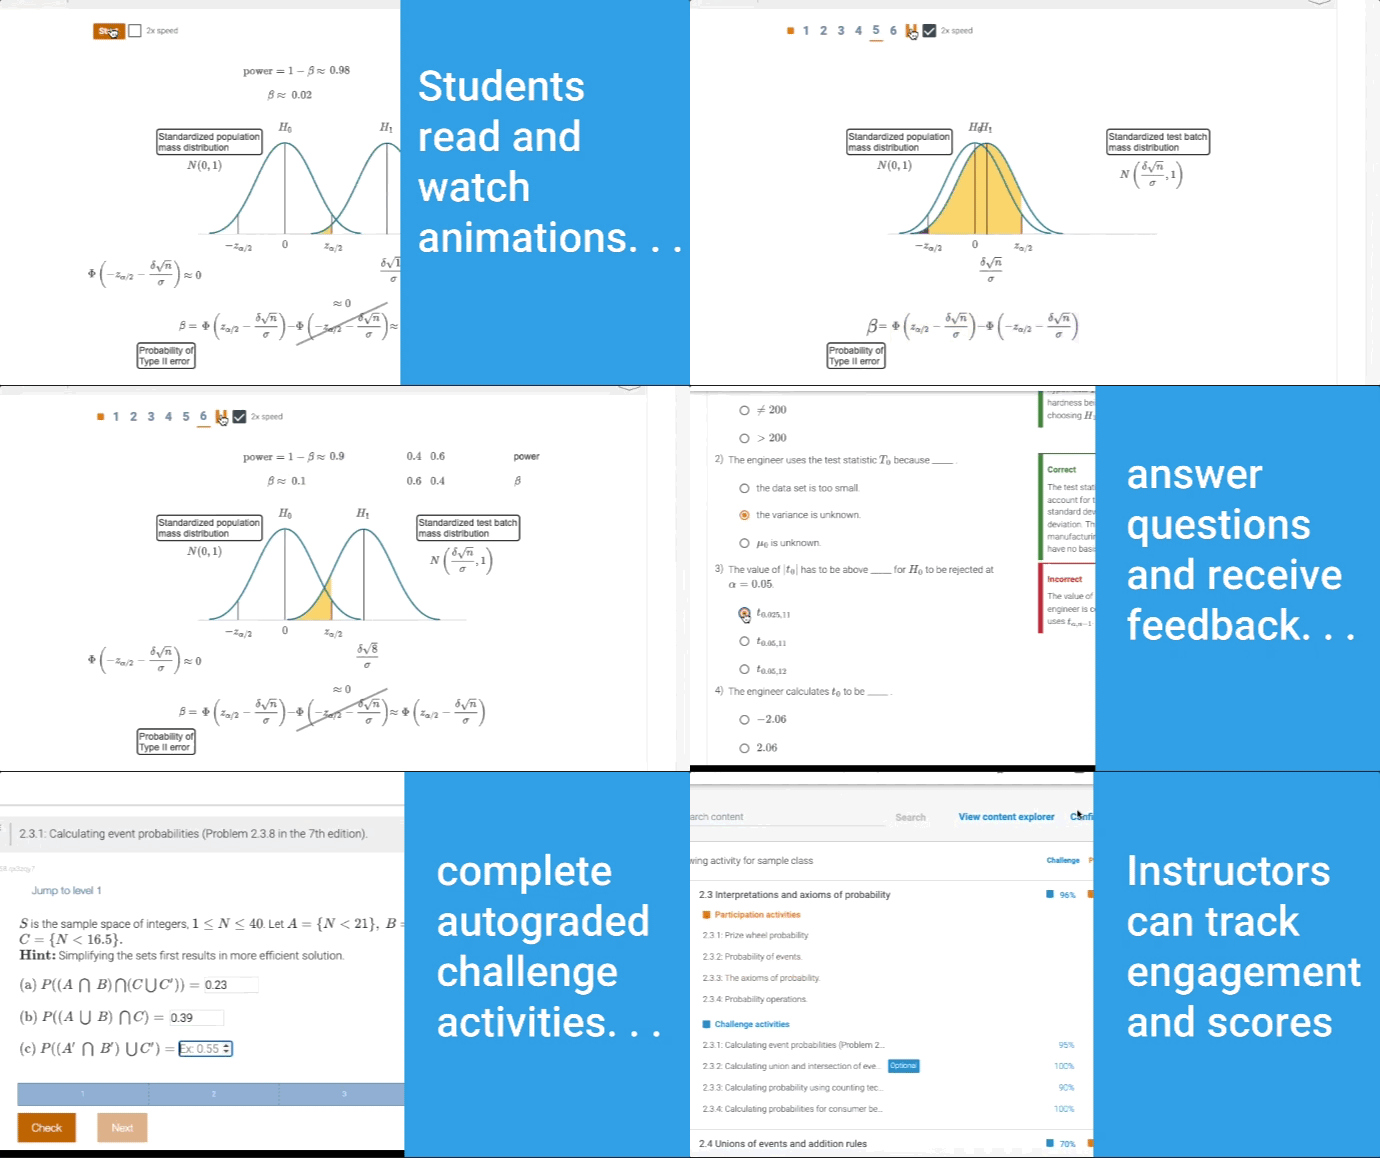
The Applied Statistics and Probability for Engineers zyVersion offers the complete contents of the 7th edition of this popular textbook, plus engages students with new interactive animations, questions, and activities; interactive distribution calculators; and over 100 solution walk-through videos.
- Students learn how the material will be relevant in their careers through realistic examples and problem sets
- Assignable and trackable reading and problems help incentivize student interaction with the content
- Includes over 600 interactive learning questions, 60 interactive animations, 3 distribution calculators and a probability distribution graph generator
- Includes 500 test bank questions that instructors can use in Word or their LMS
A practical approach to probability and statistics that focuses on real-world engineering applications, providing context, engagement and motivation for students.
The interactive Applied Statistics and Probability for Engineers zyBook in action:
What is a zyVersion?
zyVersions are leading print titles converted and adapted to zyBooks’ interactive learning platform, allowing for a quick and easy transition to an engaging digital experience for instructors and students.
zyBooks’ web-native content helps students visualize concepts to learn faster and more effectively than with a traditional textbook. (Check out our research.)
This zyVersion of Applied Statistics and Probability for Engineers benefits both students and instructors:
- Instructor benefits
- Customize your course by reorganizing existing content or adding your own
- Continuous publication model updates your course with the latest content and technologies
- Robust reporting gives you insight into students’ progress, reading and participation
- Animations and other interactive content can be shown in presentation mode and used during a lecture
- Student benefits
- Learning questions and other content serve as an interactive form of reading
- Instant feedback on labs and homework
- Concepts come to life through extensive animations embedded into the interactive content
- Save chapters as PDFs to reference the material at any time
Authors
Douglas C. Montgomery, PhD
Regents Professor of Industrial Engineering and Statistics, Arizona State University
George C. Runger, PhD
Professor. School of Engineering, Arizona State University
Key Contributors
Greg Sirokman, PhD
Content Developer at zyBooks
Prateek Shekhar, PhD
Content Developer at zyBooks
